The Beartrap of the Decade? (short version)
To “understand” the magnitude of the bear trap(the way I understand it …), I find it important to look at the chart below. It's telling me the story, how the uptrend receded and started looking like a downtrend. Or a distribution phase over 2 1/2 years.
If we follow the numbers after the top 2004 (C) , we find that the up trend from the 2003 bottom has stagnated more and more as time progressed. Trend line after trend line has been broken. Upside break outs have failed and support levels have not held either.
As we can see, the “topping process” (if this actually is a top) has been a long one, involving many people. Which means that many people are going to change their minds if what we have seen is not a top.
It now looks like we are back inside the last trend line (8), which means the (9) break was a failure – and failures often generates violent movements in the other direction, so let’s see what else we have.
William Mc Laren has on his website written on the phases of price movements and showed how price, after an initial up-move makes a pause, the up movement trails off, before the new trend starts again. This new trend can be 1) a steeper continuation of the trend or 2)a new downtrend. Let’s look at the Nasdaq index from 1989
Looking at the blue arrows we find that we have been in a slowing down period. This period does not give a clue to the continuation of the trend until we have a break of some kind. In our chart we had a DOWN break just above blue 3. This break indicates the slow period is a prelude to a new downtrend.
BUT – then again something happened, just like in the first chart.
After the break down we are now again inside the trend. It looks like the breakdown was a failure.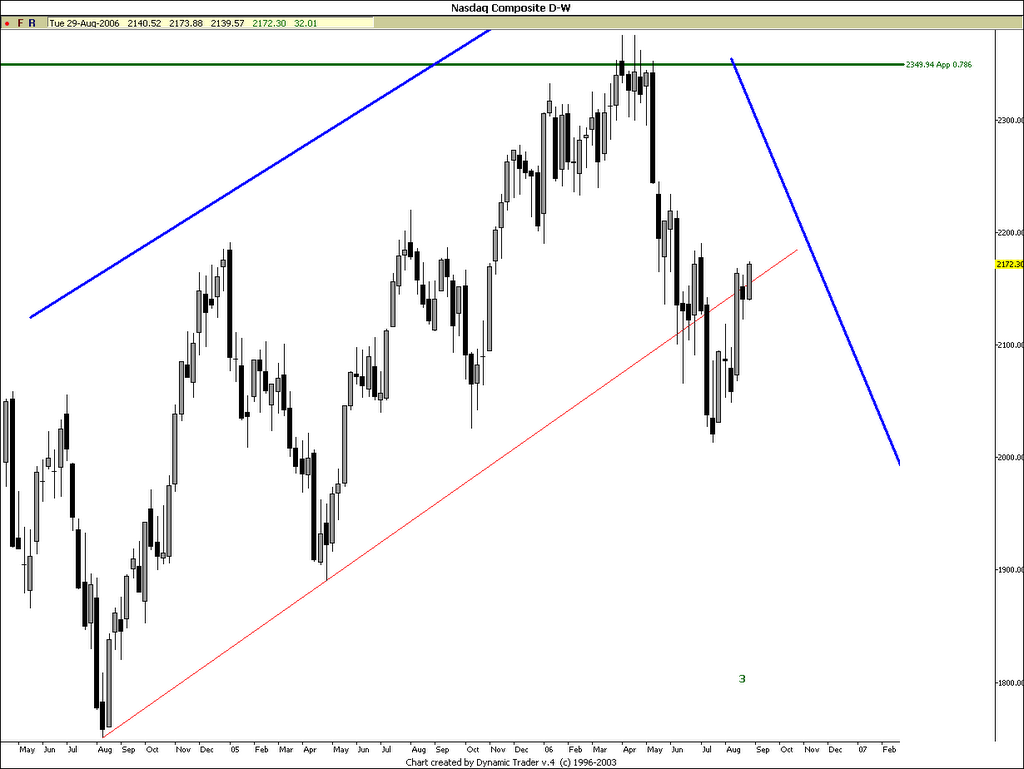
Now let's turn to SOX index (Semiconductor Index).
Here we can see the other choice. Price is turning up, we have solid price support. And we have also Time support indicating it's time to turn (grey).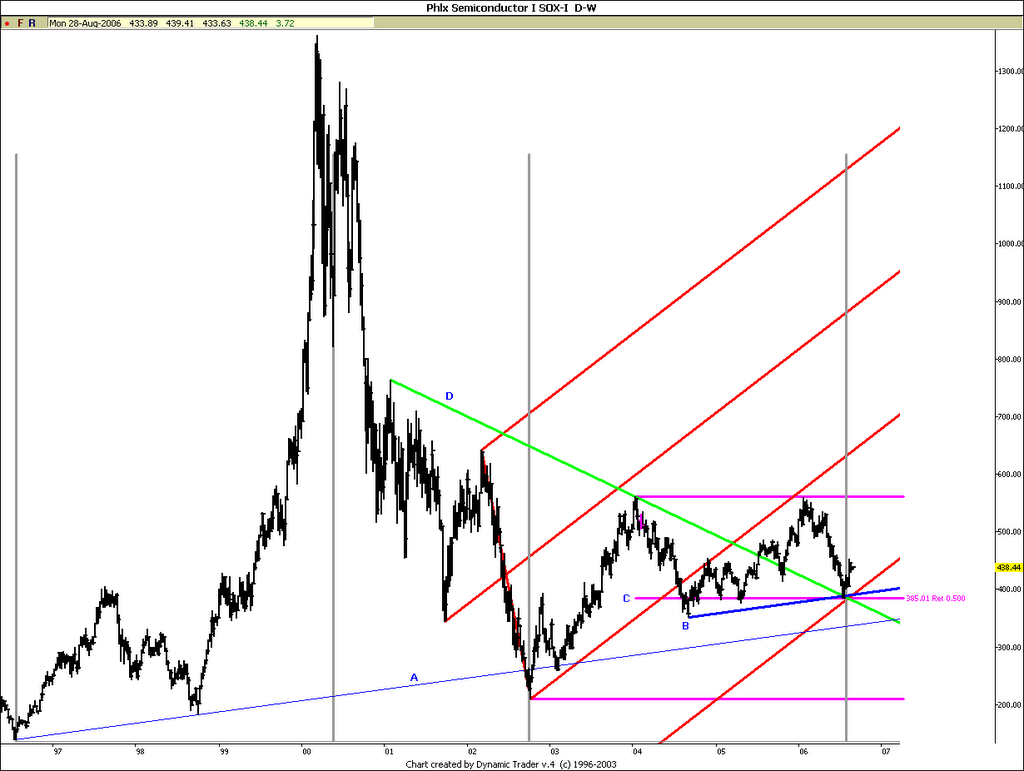
What we see below is a long term inverted H&S, with a breakdown below the neckline (failure). A breakdown that would cause a severe decline (like failed H&S patterns generally do).
But the breakdown does not follow through! We are, again, back above the blue trend line and we are struggling to get above the neckline again. We might have a failure of a failure, which produces even stronger reactions than plain failures do. Look at the oscillators below price, long and medium term, they both show bullish springboards. (the upper one even displays a failed kiss of death).
A close up below,confirms a bottoming situation. Crossover by 20MA break out of falling pennant, support at accelerating trend line and 50% retracement level.
Moving over to Nasdaq 100, daily char and sticking to the subject of failures.
I have found that finding out what price does not do, often tells a story on what will happen next.
Check out the failures below:
That's the short version - a long version can be seen at:
http://www.traders-talk.com/mb2/index.php?showtopic=58894&hl=BEAR+TRAP
Update Sep 13
The break out above the flagg seems to hold and we are also on top of an inverted H&S pattern.
The bottom could very well be in.
![]()
No comments:
Post a Comment